Overview
This design began as a focused exercise in reducing my carbon footprint — specifically looking at how my use of fossil fuels could be reduced. It evolved into something considerably larger: a design for how to make better use of my time and energy as a whole, and ultimately helped me identify when the right time was to transition to full-time permaculture work.
The design started informally without a methodology, but as its significance became clear, it was formalised into a proper permaculture design using CEAP. This is a good example of how a design can start as a simple exercise and organically grow into something more significant.
Methodology
Initially no methodology was used, as the project started as an informal exercise. Once I recognised its value as a full design, CEAP was chosen: the information collection was already substantially complete, and CEAP's lighter structure was appropriate for a personal, non-land-based design.
Working Through the Design
-
1
Collect — Urban Zones & Sectors Analysis
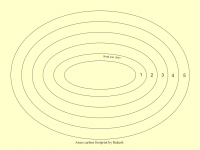
The exercise began by adapting the zones and sectors tool to map weekly travel activities. In this creative reinterpretation:
Zones were replaced by modes of transport ordered by energy efficiency: Zone 1 = walking, Zone 2 = cycling, Zone 3 = local public transport, Zone 4 = long-distance transport, Zone 5 = flying.
Sectors were replaced by categories of activity: work; friends & family; clubs & associations; local businesses; corporations; other.
This produced a map of where time and carbon were being spent — and which activities were concentrated in the high-energy zones. This became both a personal analysis tool and a teaching tool used in PDC (Permaculture Design Course) sessions.

Urban zones & sectors analysis — the adapted tool applied to travel and lifestyle 🌿 Creative Tool UseTaking an existing permaculture tool and creatively adapting it to a new context is itself good permaculture practice. When teaching this, I explain this explicitly: the zones and sectors tool was not designed for this purpose — but with a little imagination, it becomes a powerful urban lifestyle audit.Teaching Slide Show
The analysis was turned into a slide presentation used to teach zones and sectors — first in its conventional format, then showing the urban lifestyle application. The presentation was later abandoned in favour of a live whiteboard session, which proved more flexible and engaging. A good example of the principle: if a tool takes more energy than it gives back, it is not a good tool.
Conventional zones intro 
Transition to urban application 
Carbon zones mapping 
Application summary Blank Worksheet for Students
A blank version of the zones and sectors template was created for use in PDC sessions, allowing students to conduct the exercise for themselves.

Blank zones & sectors worksheet — available for student use 
Full information collection mind map -
2
Evaluate — Making Sense of the Data
The evaluation stage made sense of the collected information, looking at implications and opportunities. Where was energy and time being spent most inefficiently? What activities were generating the highest carbon but providing the least value? What patterns emerged?

Evaluation mind map -
3
Apply — Principles & Design Solutions
The design phase applied permaculture principles to the evaluated data — turning observations into a coherent set of changes to make to my lifestyle and work patterns.

Applying permaculture principles 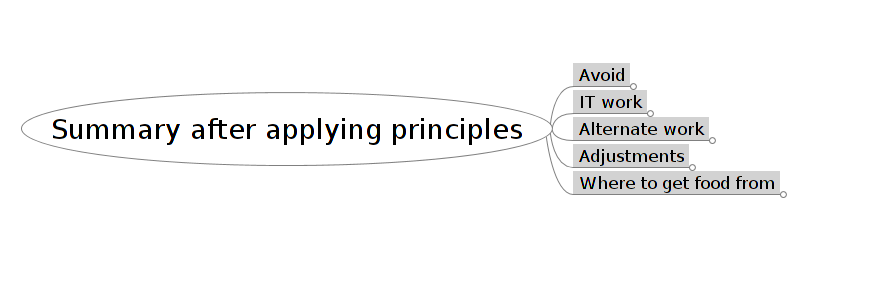
Summary of design solutions -
4
Plan, Implement & Evaluate

Implementation plan 
Implementation plan (Xmind)
Reflections & Outcomes
This design was, in the designer's own words, "extremely valuable." It completely changed his lifestyle and provided a clear, structured pathway for reducing environmental impact whilst also moving toward more meaningful work.
Importantly, the design provided a framework for evaluating the right moment to leave employed work and transition to full-time permaculture practice — a decision that a purely intuitive approach might have deferred indefinitely.